Published: 09/03/2025
Share this article

Q3 is here - and it’s not waiting for your revenue cycle to catch up.
Ambulatory clinics are entering the most demanding season of the year, when patient volumes surge, claims increase, and even minor process breakdowns can lead to major revenue loss. During this high-pressure period, many organizations discover that their billing workflows, staffing models, and reimbursement processes aren’t built to scale. The result? Delayed payments, rising denials, and unpredictable cash flow.
This is exactly when revenue cycle metrics matter most.
Tracking the right KPIs can turn reactive firefighting into proactive management. With the right data in hand, leaders can spot patterns early, address performance gaps quickly, and make informed decisions that protect both financial health and patient care operations. These same metrics also shape how we approach revenue cycle management, ensuring strategies are grounded in measurable performance.
In this article, we highlight five essential revenue cycle metrics that ambulatory care clinics must monitor during peak demand. These KPIs aren’t just numbers, they’re early warning signs, performance accelerators, and decision-making tools that help your clinic stay in control when everything else is speeding up. For a deeper look at how to strengthen your ambulatory revenue cycle management and stop common sources of financial leakage, explore our guide to improving revenue capture in outpatient settings.
Table of Contents
Hide
- 1. Why Revenue Cycle Metrics Matter Most During Peak Demand
- 2. How to Evaluate Revenue Cycle Management Performance in Ambulatory Care
- 3. Metric #1 – Days in Accounts Receivable (A/R)
- 4. Metric #2 – Clean Claim Rate
- 5. Metric #3 – Denial Rate
- 6. Metric #4 – Charge Lag
- 7. Metric #5 – Point-of-Service (POS) Collection Rate
- 8. Making Revenue Cycle Metrics Work for You
- 9. Final Thoughts – Are You Tracking What Matters Most?
- 10. Related Insights & Resources
- 11. Related Articles
Article Highlights
- Days in A/R and Charge Lag directly impact cash flow during Q3; tracking both ensures faster collections and fewer disruptions.
- A high Clean Claim Rate reduces rework and speeds reimbursement this is critical when billing teams are stretched thin.
- Monitoring POS Collection Rate strengthens front-end revenue capture and reduces the burden of chasing balances post-visit.
Why Revenue Cycle Metrics Matter Most During Peak Demand
In ambulatory care, Q3 brings a surge in patient volume that tests every facet of your operations. Front-desk staff are juggling intake with collections. Billers are racing to submit claims on time. Providers are stretched thin, leaving little margin for documentation errors or charge delays. It’s the season where every inefficiency is magnified, and without clear visibility into your revenue cycle, you’re flying blind.
This is where revenue cycle metrics become mission-critical.
Tracking the right KPIs gives ambulatory leaders a live pulse on how financial operations are holding up under pressure. These metrics expose early signs of backlogs, denials, underpayments, or charge lag; issues that are easy to miss when teams are overwhelmed and workflows are strained.
As MGMA emphasizes, focusing on a handful of high-impact revenue cycle metrics helps organizations maintain financial control and benchmark performance against top-tier ambulatory peers.
In short: when demand peaks, clarity matters. Metrics aren’t just for reporting, they’re for strategic intervention.
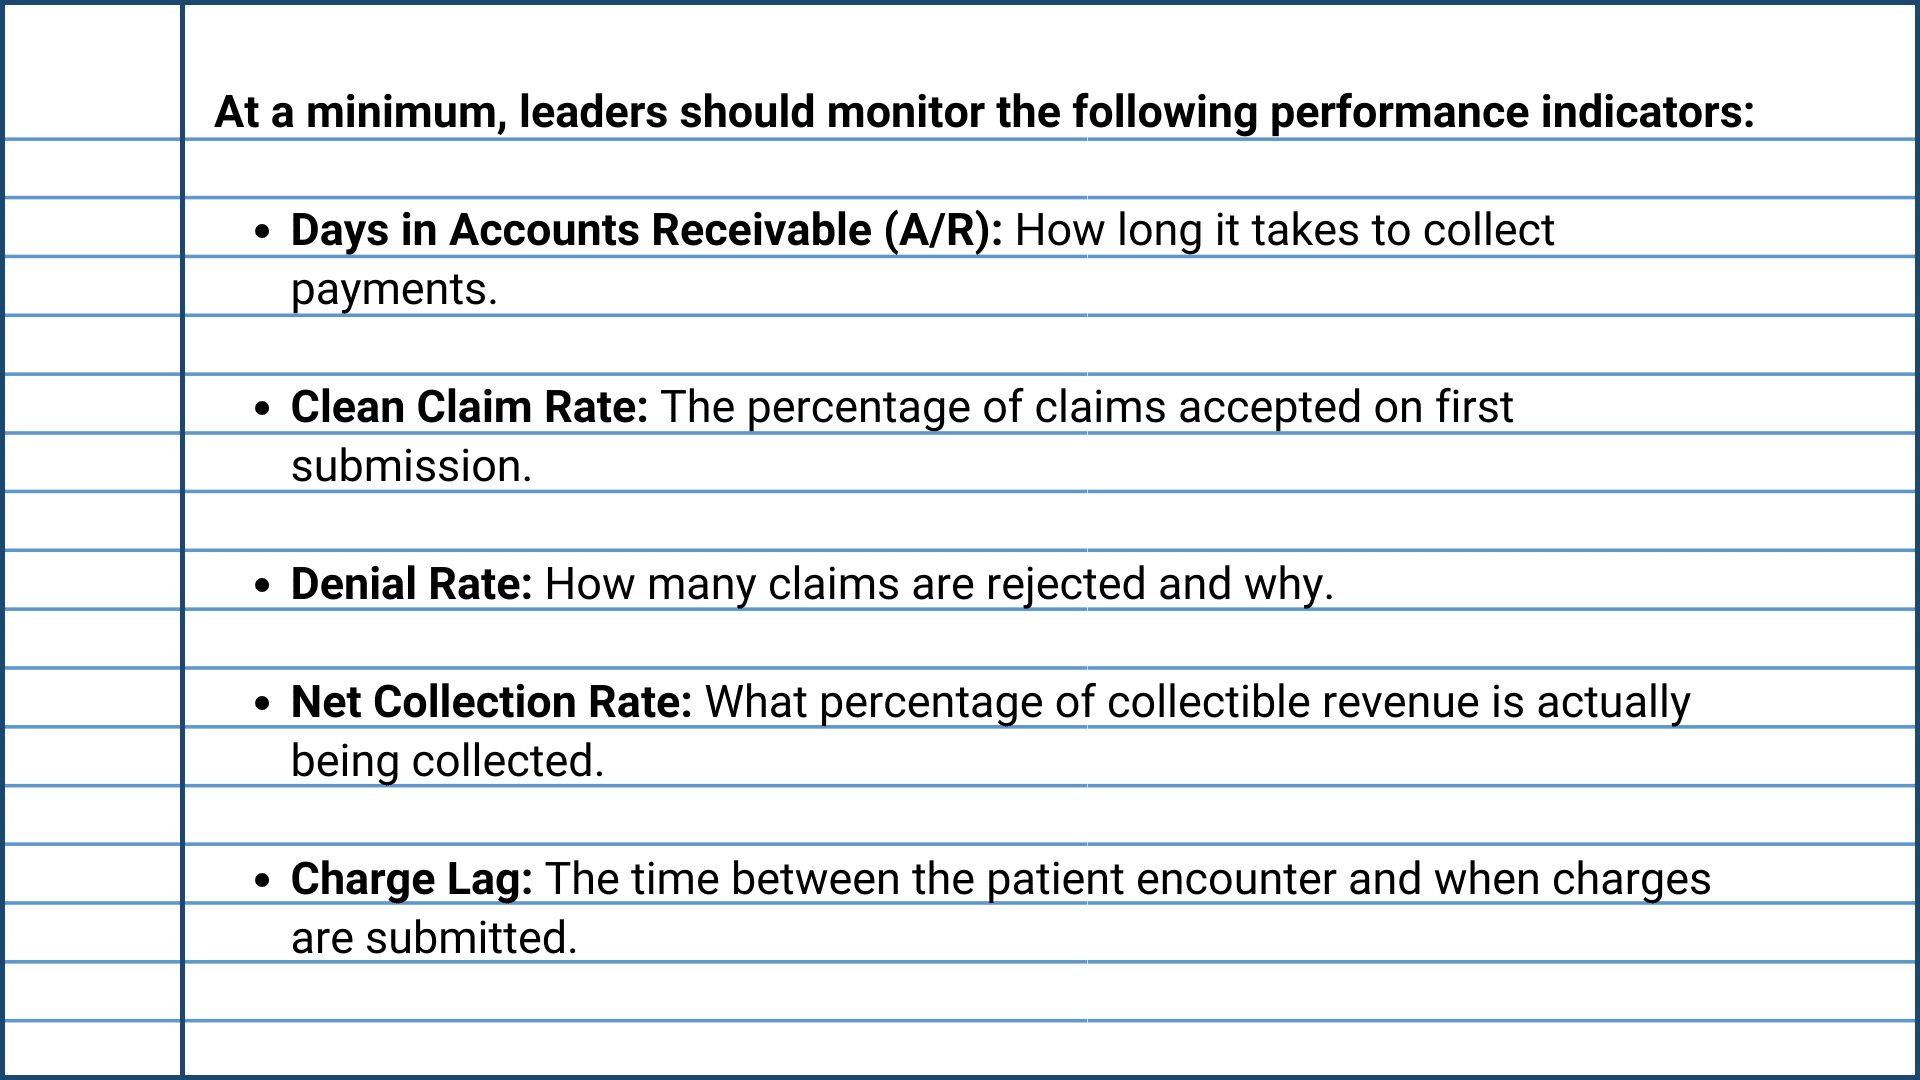
How to Evaluate Revenue Cycle Management Performance in Ambulatory Care
The best way to evaluate revenue cycle management performance is by consistently tracking a core set of metrics that measure the speed, accuracy, and efficiency of your financial operations. In ambulatory care, where volumes shift quickly and margins are tight, these metrics provide the visibility needed to catch issues early and respond with precision.
What makes these metrics valuable is their ability to reveal performance gaps, highlight process inefficiencies, and predict financial outcomes in real time. consistent drop-in clean claim rate, for example, may indicate issues in front-end documentation or eligibility verification, while rising days in A/R can signal posting delays or payer bottlenecks.
High-performing practices use these key indicators to align clinical activity with financial outcomes, ensuring the revenue cycle keeps pace with patient demand through strategic tracking of core revenue cycle KPIs.
By building your RCM evaluation around these KPIs, you move beyond reactive troubleshooting and toward data-informed decision making, a necessity during the pressure of peak season.
Metric #1 – Days in Accounts Receivable (A/R)
Days in A/R is one of the most fundamental and revealing revenue cycle metrics for ambulatory clinics. It calculates the average number of days it takes to collect payment after a patient encounter, capturing both the speed and efficiency of your billing and collections process.
During peak periods like Q3, this metric becomes even more critical. When patient volumes rise, so do claim submissions, billing errors, and payer response times. If you’re not watching Days in A/R closely, revenue can silently stall, even as your clinic seems busier than ever.
What This Metric Tells You
- Operational Efficiency: Long Days in A/R may indicate delays in charge posting, claim submission, or follow-up on unpaid accounts.
- Payer Behavior: High numbers can highlight slow-paying insurers or contract issues.
- Revenue Risk: If accounts are aging beyond 90 or 120 days, the risk of non-payment increases significantly.
Why It Matters in Q3
In high-demand seasons, staff often prioritize patient flow over back-end processes. That means claims may take longer to be submitted, reviewed, or followed up on. If not monitored, these delays extend Days in A/R and lead to cash flow strain at the exact moment when clinics need liquidity to support increased staffing, supplies, and throughput.
Worse, longer collection cycles often mask underlying issues such as:
- Insufficient billing staff coverage
- Delays in provider documentation
- EHR bottlenecks in charge capture
- Payer portal backlogs or rejections
Benchmark Targets
Most ambulatory clinics should aim for:
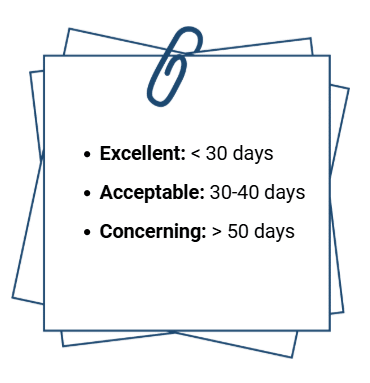
Segmenting Days in A/R by payer, service line, or encounter type can further reveal performance trends and where to focus intervention.
Actionable Steps to Improve Days in A/R
- Implement Real-Time Charge Capture: Use EHR alerts to prompt timely provider documentation and code submission.
- Prioritize Clean Claim Submission: Reduce rework by improving pre-bill audits and eligibility checks.
- Assign Ownership: Designate a team member to monitor Days in A/R weekly and escalate when thresholds are exceeded.
- Follow Up Strategically: Use A/R aging reports to direct staff toward high-value accounts nearing the 60-day mark.
- Automate Where Possible: Leverage RPA or RCM platforms to automate repetitive billing or follow-up tasks.
Days in Accounts Receivable serves as a strategic indicator that equips leaders to make timely, data-driven decisions that protect cash flow and operational stability. When monitored correctly, this metric becomes an early-warning system that protects your clinic’s cash flow during times of operational stress.
Metric #2 – Clean Claim Rate
Clean Claim Rate measures the percentage of claims that are accepted and processed by payers without needing correction or resubmission. It’s one of the clearest indicators of your front-end revenue cycle effectiveness, and one of the easiest ways to accelerate reimbursement and reduce administrative overhead.
Maintaining a strong Clean Claim Rate is essential during high-volume months. As patient flow increases, so does the likelihood of data entry errors, missed eligibility checks, coding inaccuracies, and incomplete documentation. Even minor missteps can result in claim rejections that bog down your billing team and delay payment.
What This Metric Tells You
- Claim Accuracy: High Clean Claim Rates signal effective front-end workflows, while low rates point to errors that delay revenue.
- Staff and System Performance: Reveals how well your team and systems are performing in eligibility verification, documentation, and coding.
- Process Gaps: Uncovers weaknesses in pre-bill workflows, staff training, or EHR integrations.
Why It Matters in Q3
Q3 is a stress test for your clinic’s revenue cycle. With limited time and more claims in the pipeline, your team can’t afford to spend hours reworking denials or fixing avoidable errors. Clean Claim Rate becomes the gatekeeper between high patient volume and healthy cash flow.
A dip in this metric can indicate:
- Rushed front-desk registration or demographic entry
- Incomplete provider documentation
- Inaccurate or delayed coding
- Gaps in eligibility verification workflows
Because clean claims are paid faster and require less follow-up, every percentage point improvement here translates directly into fewer delays, reduced AR aging, and lower denial rates.
Benchmark Targets

In high-performing ambulatory clinics, clean claim performance is monitored daily or weekly (not just at month-end). Leading organizations build this KPI into their standard billing dashboard and conduct trend analysis when drops occur.
Actionable Steps to Improve Clean Claim Rate
- Automate Eligibility Checks: Use real-time verification tools to confirm coverage before the visit.
- Standardize Data Entry Protocols: Ensure consistency in how staff capture insurance and demographic info.
- Pre-Bill Auditing Tools: Leverage scrubbing software to catch errors before submission.
- Invest in Coding Accuracy: Use certified coders or AI-assisted coding tools to reduce inaccuracies.
- Conduct Root Cause Analysis on Rejected Claims: Identify and fix the process, not just the individual error.

Metric #3 – Denial Rate
Denial Rate measures the percentage of claims rejected by payers after submission. It serves as a direct indicator of breakdowns within your revenue cycle. High denial rates often point to issues such as coding errors, eligibility problems, incomplete documentation, or payer-specific requirements that aren’t being met.
Denial rates often creep up unnoticed. With teams focused on keeping pace with increased patient volume, it’s easy for small oversights to multiply. A spike in denials leads to delayed payments, increased rework, and higher labor costs: impacting both cash flow and team productivity.
What This Metric Tells You
- Process Integrity: A rising denial rate reveals inconsistencies in your front-end and mid-cycle workflows.
- Training Gaps: Repeated denial reasons often point to issues with staff knowledge or process adherence.
- Payer Relations: Denial patterns by insurer can expose contract nuances, documentation rules, or systemic barriers.
Why It Matters in Q3
Every denied claim slows down your revenue cycle, and in a high-volume season, they compound stress on your team. Resubmitting, appealing, and following up on denied claims takes time that billers simply don’t have when new claims are pouring in daily.
Worse, unresolved denials quickly shift into aged A/R, increasing the risk of write-offs and lost revenue.
Monitoring this metric during peak months helps you:
- Identify trending denial reasons in real time
- Allocate staff more efficiently toward high-risk claims
- Minimize preventable rework
Benchmark Targets

Not all denials are created equal. Effective denial management starts by separating avoidable denials (e.g., missing prior auth, incorrect codes) from those that require payer intervention (e.g., coverage terminations). The more avoidable denials you reduce, the more stable your revenue becomes.
Actionable Steps to Reduce Denial Rate
- Analyze Top Denial Reasons Weekly: Prioritize process fixes based on volume and impact.
- Strengthen Pre-Visit Workflows: Ensure eligibility, authorization, and documentation are validated before the claim cycle begins.
- Standardize Coding Practices: Use audit tools or coder peer reviews to ensure consistency.
- Create a Denial Prevention Task Force: Cross-functional teams can track trends, test solutions, and train staff on common issues.
- Monitor Payer-Specific Denials: Adjust workflows and documentation to meet each payer’s nuances.
Maintaining a low denial rate reflects strong operational performance and gives your clinic a measurable edge in financial efficiency. It allows your clinic to move claims through the pipeline faster, free up staff capacity, and retain more of the revenue you’ve earned-especially when it matters most.
Metric #4 – Charge Lag
Charge Lag measures the time between when a service is provided and when the corresponding charges are entered into your billing system. It’s a crucial yet often overlooked metric that directly impacts the speed of reimbursement, the accuracy of claims, and overall cash flow stability.
When clinics are operating at full capacity (as they often are in Q3) delays in charge entry can easily go unnoticed. Providers may fall behind on documentation, coding teams may be overwhelmed, or billing workflows may be dependent on manual handoffs. Over time, these small delays create significant bottlenecks in your revenue cycle.
What This Metric Tells You
- Billing Responsiveness: Charge lag reveals how quickly clinical documentation is converted into revenue activity.
- Provider and Staff Workflow Efficiency: Long lag times often highlight breakdowns in documentation, coding, or communication.
- Revenue Timing: Delayed charges result in delayed claims, which delays reimbursement and restricts cash flow.
Why It Matters in Q3
High-volume months increase the risk of documentation backlogs. When providers are seeing more patients each day, even small delays in chart completion can snowball. If charges aren’t submitted quickly, billing teams can’t keep pace, and the clinic’s ability to maintain predictable cash flow is compromised.
More critically, long charge lag increases the risk of:
- Missed or forgotten charges
- Delayed error detection
- Expired filing deadlines for some payers
- Inaccurate reporting and forecasting
While it’s tempting to “catch up later,” revenue lost due to poor charge management is often unrecoverable
Benchmark Targets

Even one extra day of lag across hundreds of patient visits can result in substantial revenue delays. Monitoring this metric daily can help uncover and address process breakdowns before they turn into financial slowdowns.
Actionable Steps to Reduce Charge Lag
- Set Clear Documentation Deadlines: Establish internal expectations for chart completion within 24 hours of service.
- Automate Charge Capture: Leverage your EHR to auto-populate charge codes based on documentation inputs.
- Enable Real-Time Coding Support: Use embedded coding tools or remote coders to reduce backlog.
- Assign Lag Accountability: Designate a staff member or team to monitor lag time and escalate recurring delays.
- Provide Targeted Provider Feedback: Share performance metrics with clinicians to increase awareness and buy-in.
Timely, accurate charge entry creates a foundation for clean claims, faster payments, and stronger financial visibility across your organization.

Metric #5 – Point-of-Service (POS) Collection Rate
Point-of-Service (POS) Collection Rate tracks the percentage of patient payments collected at the time of service, before the patient leaves your clinic. This metric is a direct reflection of how well your front-desk team is prepared, trained, and empowered to collect patient financial responsibility in real time.
With the rise of high-deductible health plans, more financial responsibility has shifted to patients. That makes the moment of service one of the most critical opportunities to secure payment. If it’s missed, the likelihood of collecting drops significantly-especially in the weeks following a visit.
What This Metric Tells You
- Front-End Effectiveness: A low POS collection rate may indicate poor communication of patient balances, inconsistent policy enforcement, or inadequate staff training.
- Revenue Capture Potential: Shows how much patient revenue is being collected up front versus being chased post-visit.
- Patient Financial Engagement: Strong POS performance typically reflects transparent financial conversations and proactive planning.
Why It Matters in Q3
When patient volume spikes, front-office staff have less time for extended financial discussions. That often leads to missed payment opportunities and a ballooning volume of unpaid balances that later require time-consuming follow-up, or worse, end in write-offs.
Improving POS collection is one of the most effective ways to stabilize cash flow during high-demand periods without increasing back-office burden. Every dollar collected before the patient leaves is one less dollar that has to be billed, reminded, and pursued.
Benchmark Targets
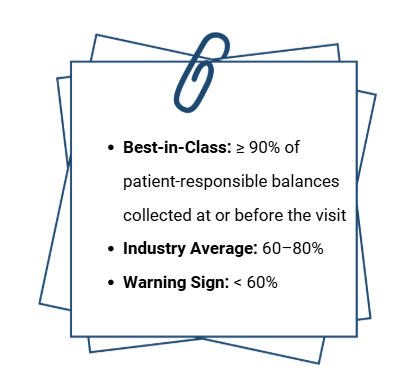
Tracking this metric weekly or monthly during peak seasons helps you identify dips in staff performance, patient compliance, or system workflows that may be preventing timely collections.
Actionable Steps to Improve POS Collection Rate
- Provide Real-Time Cost Estimates: Use eligibility tools to inform patients of their financial responsibility before check-in.
- Implement Clear Financial Policies: Ensure patients are aware of expectations prior to arrival and at every point of contact.
- Train Staff in Financial Conversations: Equip front-desk teams with scripts and techniques to communicate balances confidently and compassionately.
- Offer Flexible Payment Options: Enable mobile payments, card-on-file, or payment plans to remove friction.
- Set Collection Goals: Monitor staff performance and recognize high performers to reinforce accountability.
Improving your Point-of-Service Collection Rate doesn’t just help with revenue, it builds trust and transparency. When patients know what to expect financially and have the ability to pay easily, your clinic benefits from stronger relationships and fewer billing headaches down the line.
If gaps in front-end collections are exposing deeper issues in your workflows or staffing, explore our guide on solving key revenue cycle management challenges to reinforce your foundation and recover missed revenue.
Making Revenue Cycle Metrics Work for You
Tracking revenue cycle metrics drives momentum by enabling timely decisions, focused action, and continuous improvement. Metrics are only valuable when they’re used to drive timely decisions, guide staff performance, and inform strategic adjustments. During peak season, when volume is high and time is limited, that distinction becomes even more important.
The five metrics outlined in this article: Days in A/R, Clean Claim Rate, Denial Rate, Charge Lag, and POS Collection Rate, are more than individual indicators. Together, they form a dashboard for financial clarity. They help leaders not only identify problems but also predict risks, align resources, and build more resilient operations.
To make metrics actionable:
- Review them weekly or biweekly during peak periods to spot trends early.
- Create dashboards that are accessible to billing teams, administrators, and providers so insights are shared, not siloed.
- Tie KPIs to performance goals, so staff understand how their work impacts financial health.
- Use real-time data to trigger interventions, not just monthly reports.
Whether it’s reassigning follow-up tasks, providing additional coding support, or launching a denial prevention initiative, leadership grounded in data ensures your clinic stays agile, even when demand is at its highest.
Metrics are key leadership tools. And in ambulatory care, where every dollar and every day matters, leading with data is the only way to stay ahead.
See how your RCM metrics measure up. Evaluate your billing performance with clarity and confidence. Our free RCM Performance Benchmarks & Metrics Guide outlines the key performance indicators every healthcare organization should be tracking along with industry benchmark ranges to help you identify opportunities for improvement.

Final Thoughts – Are You Tracking What Matters Most?
When patient volume spikes and operational complexity increases, revenue can slip through the cracks (quickly and quietly). That’s why peak demand seasons aren’t just a test of your clinic’s capacity, they’re a test of your visibility. And visibility starts with the right metrics.
The five KPIs outlined in this article offer a strategic lens into every stage of your revenue cycle. They help you move faster, respond earlier, and lead more effectively under pressure. But knowing which metrics to track is just the first step; what you do with that insight is what drives performance.
John Lynch & Associates works with ambulatory clinics across the country to turn RCM data into meaningful results through our Revenue Cycle Management consulting services. Whether you're experiencing rising A/R, increased denials, or declining POS collections, our team can help you take decisive action, without overhauling your entire operation.
Let’s make your revenue cycle peak-ready.
Contact us today to evaluate your KPI performance and implement targeted strategies that improve collections, reduce friction, and strengthen financial resilience when it matters most.
Ready to Talk?
We partner with forward-thinking healthcare leaders to shape the future. By understanding your goals, we build strategies that improve operations, exceed financial targets, and elevate patient care. Contact us to get started!
Contact us
Related Insights & Resources
- John Lynch & Associates: Is Your Ambulatory Practice Leaving Money on the Table?
This article breaks down common causes of missed revenue in outpatient clinics and offers practical strategies to improve revenue capture. - John Lynch & Associates: 5 Revenue Cycle Management Challenges and How to Solve Them
A focused guide on addressing key RCM pain points, from front-end collections to payer denials, with actionable solutions for ambulatory leaders. - MGMA: Measuring Success – Finding the Right Metrics to Optimize the Revenue Cycle
MGMA outlines how focusing on a few high-impact KPIs can help clinics benchmark performance and make smarter financial decisions. - Veradigm: Top 3 KPIs for Revenue Cycle Management
This piece highlights three essential RCM metrics, including Days in A/R and Clean Claim Rate, and how they support financial agility.